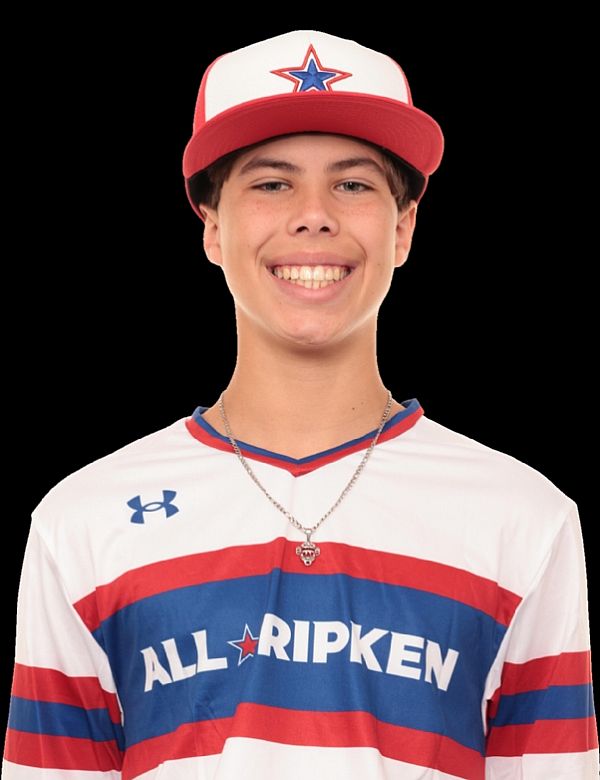
10/25/2024 - All-Ripken Games - Broussard, LA Peyton was a key participant at the All-Ripken games in Broussard, LA, where his skills stood out both behind the plate and on the mound. As a catcher, Peyton demonstrated a solid and accurate throwing arm, consistently receiving the baseball with a staggered stance that allowed him to efficiently transition into his "launch" phase when throwing to his target. To enhance his throwing mechanics, Peyton could focus on generating more ground force during the transfer, helping him cover more distance with his throws and maintain accuracy under pressure. At the plate, Peyton�s balanced setup allowed for a strong, line-drive bat path through the hitting zone. His ability to stay through the ball and create solid contact made him a reliable threat offensively, with a natural tendency to drive the ball with authority. On the mound, Peyton showed a solid balance position and the ability to get ahead of hitters with good command. As part of his ongoing development as a pitcher, focusing on utilizing his legs more in his delivery could help him increase velocity while also creating a more consistent downward angle to the plate. This adjustment would make him even more effective at generating ground balls and generating swings and misses. Overall, Peyton's performance across multiple facets of the game highlighted his versatility, and with continued refinement, he has the potential to be a standout player in all areas.
Peyton Conerly C/3B
- Natchez, MS
- Adams County Christian School
- Travel Team: Knights Knation
- Grad 2028
- Ht 5'11''
- Wt 160 lbs
- Throws Right
- Bats Right
- Arm 70 mph
- 60 YD 8.14 Sec
Running
- 1.59 sec 10 Yds
- 5.73 sec 40 Yds
- 8.14 sec 60 Yds
- 5.20 sec H > 1B (RHH)
- 5.08▲ sec Shuttle (L)
- 5.12 sec Shuttle (R)
Strength
- 8'0''▲ Broad Jump
- 98▲ psi Grip (L)
- 100▲ psi Grip (R)
Throwing
- 70 mph▲ mph Velocity
- 40 Arm Grade
Position - 3B
- N/A Fielding Grade
Hitting
- 42 Hitting Grade (R)
- 40 Power Grade (R)
- 73 mph▲ mph Exit Velocity
Catching
- 42 Receiving Grade
- 35 Blocking Grade
- 2.31▲ sec Release Time
Official Scouting Report
Profile
Peyton Conerly
Natchez, MS
info@factoryathletics.com
800-641-4487
@baseballfactory
| Primary Position C | ||
| Grad Year 2028 | Secondary Position 3B | |
| High School Adams County Christian School | Bats Right | |
| Height 5'11'' | Throws Right | |
| Weight 160 LBS | Arm 70 mph | |
| 60 YD 8.14 |
Tool Grade Scale
Our main goals with the BF "10-70" Scouting Scale are to provide the player with a realistic evaluation of his "PRESENT" abilities (what he can do today), and to provide college coaches with information they can use to identify and/or compare potential recruits.
Tools are graded for all players and pitchers, regardless of age or graduation year. However, for High School players we use only grades 20-70 (grades 10-18 do not apply), while for Middle School players we use only grades 10-52 (grades 55-70 do not apply).
| Grade | Middle School (Ages 11-13) Description | High School (Ages 14-18) Description | 10 Yard Dash (seconds) | 40 Yard Dash (seconds) | 60 Yard Dash (seconds) | Home-1B LHH (seconds) | Home-1B RHH (seconds) | 5-10-5Shuttle [LEFT] (seconds) | 5-10-5Shuttle [RIGHT] (seconds) | Broad Jump (inches) | Grip Strength [LEFT] (psi) | Grip Strength [RIGHT] (psi) | FB & Raw Velocity (mph) | Bat Exit Velocity (mph) | Catcher Release (seconds) |
| 10 | Poor | -----N/A----- | 2.50+ | 7.50+ | 10.50+ | 6.70+ | 6.80+ | 6.80+ | 6.80+ | 35- | 30- | 30- | 40- | 30- | 3.70+ |
| 12 | Well Below Avg | -----N/A----- | 2.40 | 7.40 | 10.00 | 6.40 | 6.50 | 6.60 | 6.60 | 40 | 35 | 35 | 42 | 35 | 3.50 |
| 15 | -----N/A----- | 2.35 | 7.30 | 9.75 | 6.10 | 6.20 | 6.40 | 6.40 | 45 | 40 | 40 | 45 | 38 | 3.25 | |
| 18 | Below Avg | -----N/A----- | 2.30 | 7.20 | 9.50 | 6.00 | 6.10 | 6.20 | 6.20 | 50 | 45 | 45 | 48 | 40 | 3.15 |
| 20 | Poor | 2.25 | 7.00 | 9.25 | 5.90 | 6.00 | 6.00 | 6.00 | 55 | 50 | 50 | 51 | 45 | 3.10 | |
| 22 | Near Avg | 2.15 | 6.50 | 9.00 | 5.80 | 5.90 | 5.85 | 5.85 | 60 | 55 | 55 | 54 | 50 | 3.00 | |
| 25 | Well Below Avg | 2.10 | 6.25 | 8.75 | 5.70 | 5.80 | 5.75 | 5.75 | 64 | 60 | 60 | 58 | 55 | 2.90 | |
| 28 | MS Average | 2.05 | 6.15 | 8.50 | 5.45 | 5.55 | 5.50 | 5.50 | 68 | 65 | 65 | 62 | 60 | 2.80 | |
| 30 | Below Avg | 2.00 | 5.95 | 8.25 | 5.40 | 5.50 | 5.25 | 5.25 | 74 | 70 | 70 | 63 | 62 | 2.70 | |
| 32 | Solid Avg | 1.95 | 5.80 | 8.00 | 5.20 | 5.30 | 5.10 | 5.10 | 78 | 80 | 80 | 67 | 65 | 2.60 | |
| 35 | Near Avg | 1.90 | 5.65 | 7.75 | 4.90 | 5.00 | 5.00 | 5.00 | 82 | 90 | 90 | 71 | 70 | 2.50 | |
| 38 | Above Avg | 1.88 | 5.45 | 7.50 | 4.80 | 4.90 | 4.95 | 4.95 | 86 | 100 | 100 | 75 | 75 | 2.40 | |
| 40 | HS Average | 1.85 | 5.25 | 7.40 | 4.70 | 4.80 | 4.90 | 4.90 | 93 | 110 | 112 | 79 | 80 | 2.25 | |
| 42 | Well Above Avg | 1.82 | 5.20 | 7.30 | 4.60 | 4.70 | 4.80 | 4.80 | 98 | 115 | 115 | 81 | 82 | 2.15 | |
| 45 | Solid Avg | 1.80 | 5.18 | 7.20 | 4.50 | 4.60 | 4.70 | 4.70 | 103 | 118 | 118 | 83 | 84 | 2.10 | |
| 48 | Excellent | 1.78 | 5.16 | 7.10 | 4.45 | 4.55 | 4.60 | 4.60 | 108 | 120 | 120 | 85 | 86 | 2.05 | |
| 50 | Above Avg | 1.76 | 5.14 | 7.05 | 4.40 | 4.50 | 4.50 | 4.50 | 113 | 125 | 125 | 86 | 88 | 2.00 | |
| 52 | Outstanding | 1.74 | 5.12 | 7.00 | 4.35 | 4.45 | 4.40 | 4.40 | 118 | 128 | 128 | 87 | 90 | 1.98 | |
| 55 | -----N/A----- | Well Above Avg | 1.72 | 5.10 | 6.95 | 4.30 | 4.40 | 4.30 | 4.30 | 123 | 130 | 130 | 88 | 92 | 1.95 |
| 58 | -----N/A----- | 1.70 | 5.05 | 6.90 | 4.25 | 4.35 | 4.25 | 4.25 | 128 | 135 | 135 | 89 | 94 | 1.93 | |
| 60 | -----N/A----- | Excellent | 1.68 | 5.00 | 6.85 | 4.20 | 4.30 | 4.20 | 4.20 | 133 | 138 | 138 | 90 | 95 | 1.90 |
| 62 | -----N/A----- | 1.66 | 4.95 | 6.80 | 4.15 | 4.25 | 4.15 | 4.15 | 138 | 140 | 140 | 91 | 96 | 1.88 | |
| 65 | -----N/A----- | Outstanding | 1.64 | 4.90 | 6.70 | 4.10 | 4.20 | 4.10 | 4.10 | 143 | 145 | 145 | 93 | 97 | 1.85 |
| 68 | -----N/A----- | 1.62 | 4.85 | 6.60 | 4.05 | 4.15 | 4.05 | 4.05 | 148 | 150 | 150 | 94 | 98 | 1.82 | |
| 70 | -----N/A----- | Superior | 1.60- | 4.80- | 6.50- | 4.00- | 4.10- | 4.00- | 4.00- | 150+ | 155+ | 155+ | 95+ | 99+ | 1.80- |
This player page has been disabled or does not exist.
Please email info@baseballfactory.com or call 800-641-4487 for assistance.